The “Edge Analytics” page gives you insight into how many requests for your content are being handled by the Edge servers and how much volume is being consumed delivering from them, as well as performance per session and concurrent users. The dashboard has four tabs: Performance Graph, Performance Table, Availability and Response Time. You can refine your graph limiting the data shown utilizing few filters, selecting:
- Content ID: ContentID or content title. After typing the third letter you will be presented with a list of suggested finds
- Hostname: the hostnames involved
- Delivery Format: Dash, HLS, Images and more
- Country: specific countries
- ISP: specific Internet Service Provider
- IP Version: IPv4 or IPv6
- Delivery Option: Standard Secure Traffic or Non Secure
Performance Graph
Edge Hit Count

This graph shows how many requests were managed by the Edge servers. Edge Hits represents how many requests were made for content by the player and how many times those requests were handled by the Edge servers.
Edge Volume | Throughput

Edge Volume represents how much traffic was consumed handling requests and delivering content from the Edge, with the total shown in the legend on the right. The dots represent the peak of the throughput traffic.
Average Performance Per Session

This graph shows the average session performance speed of requests for content being served by the Edge servers, giving you insight into how your content is delivered, representing the Mbps of the average user download speed requests for content over a time period.
Concurrent Sessions

This graph shows the average concurrent sessions alongside the max concurrent sessions, helping you identify when peak traffic happens as well as understanding the average amount of users you normally get over a set time period. Concurrent Session Average represents the average amount of sessions tracked over a set time period. Concurrent Session Max represents the peak concurrent session count over a set time period.
Performance Table
Edge Throughput By Content Id

This list shows how the Edge’s throughput has been per content piece, helping you understand the performance of your library. Information is separated by Content ID, Volume, Hits and the Primary Users Average Throughput.
Edge Throughput By Country

This list shows how the Edge’s throughput has been per country delivered to, helping you understand the performance of your content in different countries. Information is separated by Content ID, Volume, Hits and the Primary Users Average Throughput.
Edge Throughput By Delivery Format

This list shows how the Edge’s throughput has been per delivery format, helping you understand the performance of your content in different formats. Information is separated by Content ID, Volume, Hits and the Primary Users Average Throughput.
Edge Throughput By ISP

This list shows how the Edge’s throughput has been through every ISP the content has passed through, helping you understand the performance of your content over different ISPs. Information is separated by ISP, Autonomous System Number, Volume, Hits and the Primary Users Average Throughput.
Availability
Edge Hit Count

This graph shows how the Edge servers response codes divided by hits, helping you understand what is happening with your content in the delivery workflow. 2xx represent requests successfully received 3xx represent a redirection 4xx represent client errors 5xx represent server errors Other represent additional response codes not commonly seen On top of the STACKED and NORMAL visualization, you can select HISTOGRAM where you can see the different codes count separated.
Edge Response %
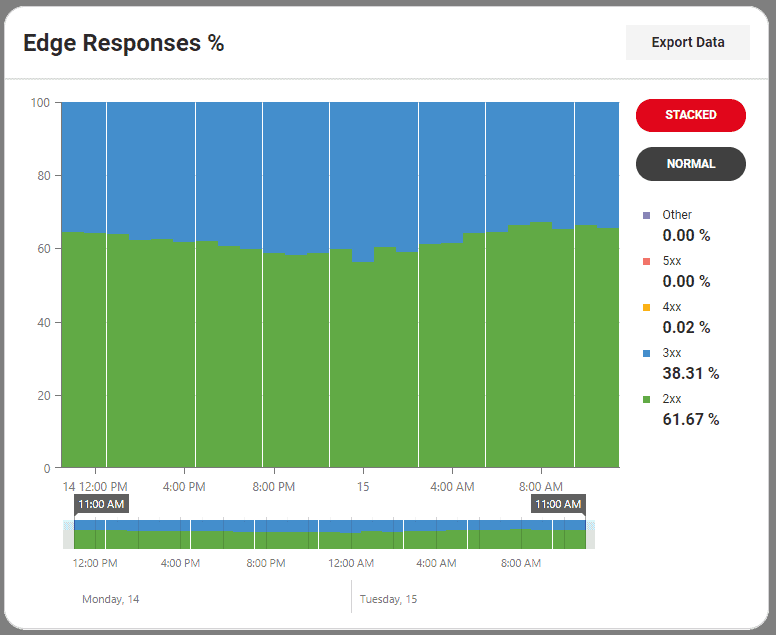
This graph shows how the Edge servers response codes in percentage, helping you understand what is happening with your content in the delivery workflow. 2xx represent requests successfully received 3xx represent a redirection 4xx represent client errors 5xx represent server errors Other represent additional response codes not commonly seen
Edge Responses by Content ID

This list shows how the Edge servers’ responses divided by Content ID when the content has been requested. Information is separated by Content ID, 2xx, 3xx, 4xx, 5xx, Other and Total.
Edge Responses by Country

This list shows how the Edge servers’ responses divided by country when the content has been requested. Information is separated by Content ID, 2xx, 3xx, 4xx, 5xx, Other and Total.
Edge Responses by ISP

This list shows how the Edge servers’ responses divided by ISP when the content has been requested. Information is separated by ISP, Autonomous System Number, 2xx, 3xx, 4xx, 5xx, Other and Total.
Response Time
Edge Response Time

This graph shows the Edge servers average response time alongside the Edge servers minimum response time. Response Time Average represents the average response time tracked over a set time period. Response Time Min represents the minimum response time tracked over a set time period.
