Global Analytics - General
In this page you will find three tabs relative to your property performances: Volume, Hits and Bandwidth. You can refine your graph limiting the data shown utilizing few filters, selecting:
- Property: your properties. If nothing is selected the global data across properties will be shown
- Business Region: global data, business regions and your eventual private networks (up to two)
Volume
Volume Per Property
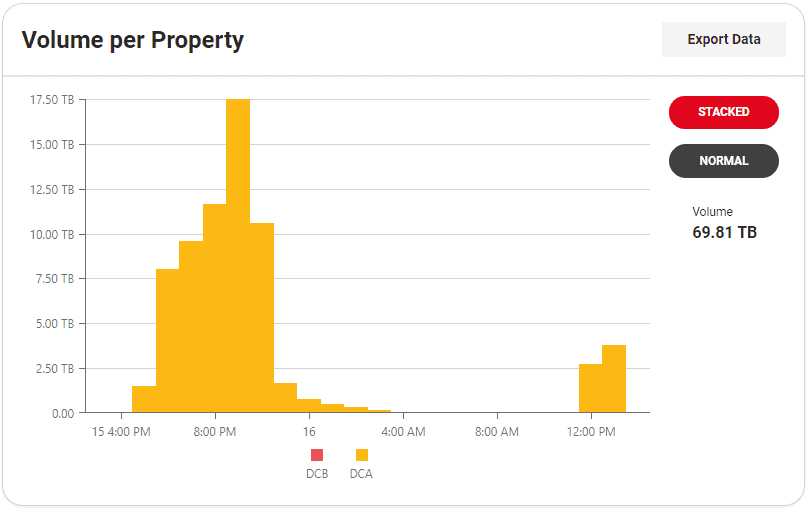
This graph shows the volume of requests managed by the Edge aggregated by Property. The legend on the right side gives you the Volume total.
Volume Per Business Region
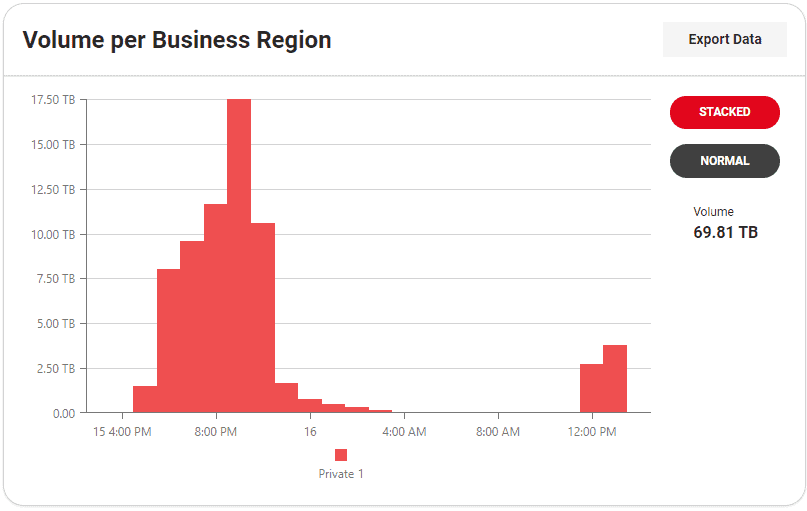
This graph shows the volume of requests managed by the Edge aggregated by Business Region. The legend on the right side gives you the Volume total.
Top Volume Per Property

This list shows the top volume of each property giving you the information about Property Code, Property Title and Volume, aggregated by Volume. Clicking on the columns title you can sort the data, ascending or descending. You are able to scroll vertically through the results as well.
Top Volume Per Business Region

This list shows the top volume of each business region giving you the information about Business Region and Volume, aggregated by Volume. Clicking on the columns title you can sort the data, ascending or descending. You are able to scroll vertically through the results as well.
Hits
Hits Per Property
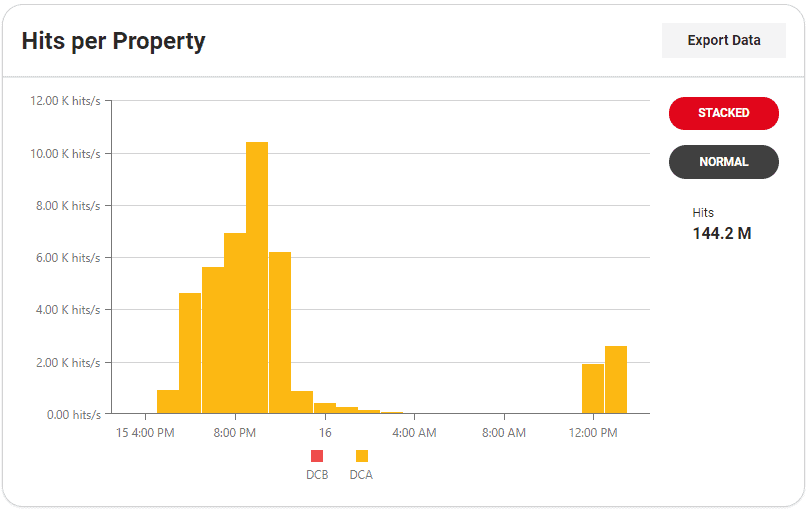
This graph shows you how many HTTP requests where handled for your content per Property. The legend on the right side gives you the total of hits. If you pass your mouse pointer over a bar, a tooltip will show up with some specific data relative to that specific property.
Hits Per Business Region
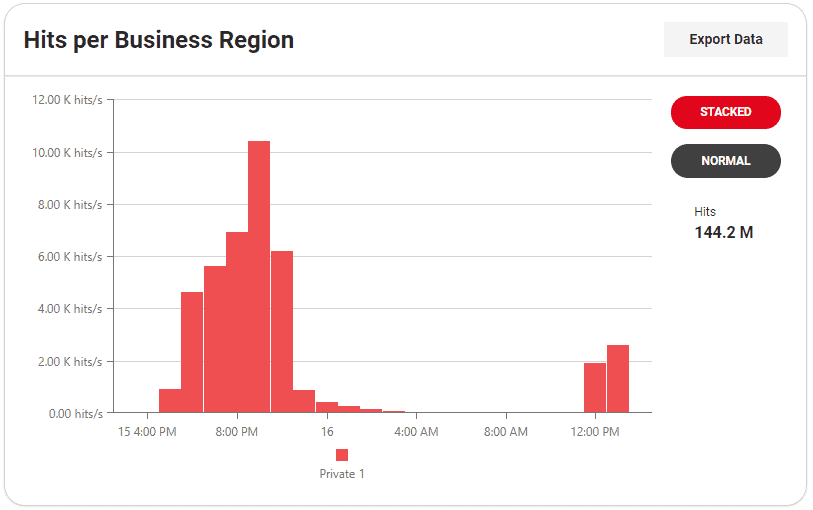
This graph shows you how many HTTP requests where handled for your content per business region. The legend on the right side gives you the total of hits. If you pass your mouse pointer over a bar, a tooltip will show up with some specific data relative to that specific region.
Top Hits Per Property

This list shows the top hits per property giving you the information about Property Code, Property Name and Hits, aggregated by Property Code. Clicking on the columns title you can sort the data, ascending or descending. You are able to scroll vertically through the results as well.
Top Hits Per Business Region

This list shows the top hits per business region giving you the information about Business Region and Hits, aggregated by Business Region. Clicking on the columns title you can sort the data, ascending or descending. You are able to scroll vertically through the results as well.
Bandwidth
Bandwidth Per Property
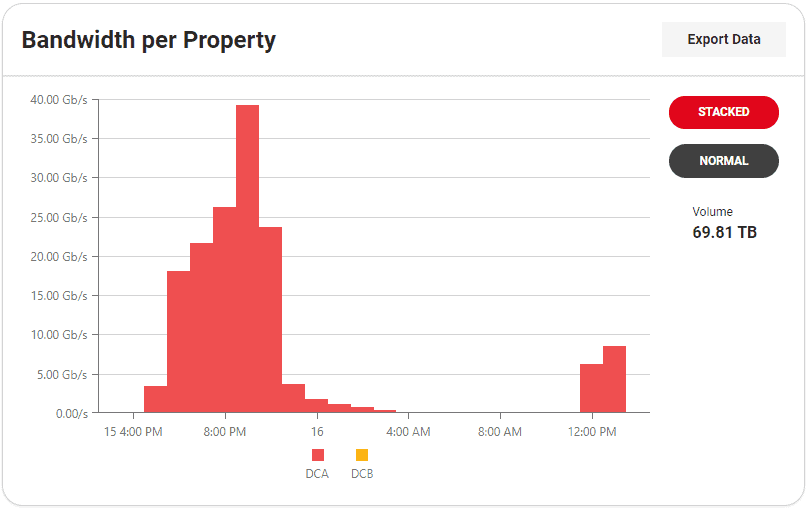
This graph shows the bandwidth erogated, aggregated by Property. The legend on the right side gives you the Volume total.
Bandwidth Per Business Region
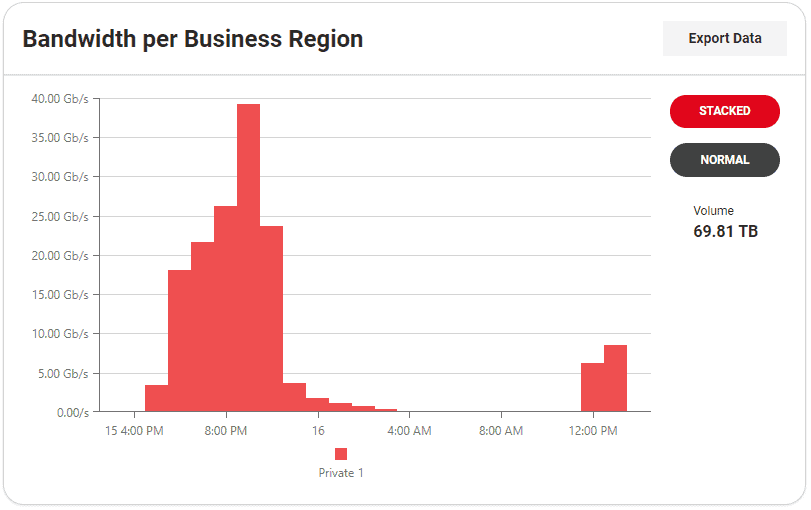
This graph shows the bandwidth erogated, aggregated by Business Region. The legend on the right side gives you the Volume total.
Volume Per Property

This list shows the top volume consumed per property giving you the information about Property Code, Property Name and Hits, aggregated by Property Code. Clicking on the columns title you can sort the data, ascending or descending. You are able to scroll vertically through the results as well.
Volume Per Business Region

This list shows the top volume consumed per business region giving you the information about Property Code, Property Name and Hits, aggregated by Property Code. Clicking on the columns title you can sort the data, ascending or descending. You are able to scroll vertically through the results as well.

