Video Detail
In this page you will find four tabs relative to your property performances: Sessions, Response Codes, Hits and Volume. You can refine your graph limiting the data shown utilizing few filters, selecting:
- Property: your properties. If nothing is selected the global data across properties will be shown
- Business Region: global data, business regions and your eventual private networks (up to two)
On the page top right you can find a calendar where you can decide what time frame to include in your graphs by choosing specific dates and time or Last Hour, Last 4 hours, Last 24 Hours, Today, Yesterday, Last 7 Days, Last Thirty Days and This Month. Also, you can decide what kind of aggregation to visualize, like: 5 min, Hourly, Daily and Monthly.
Sessions
Sessions By Property
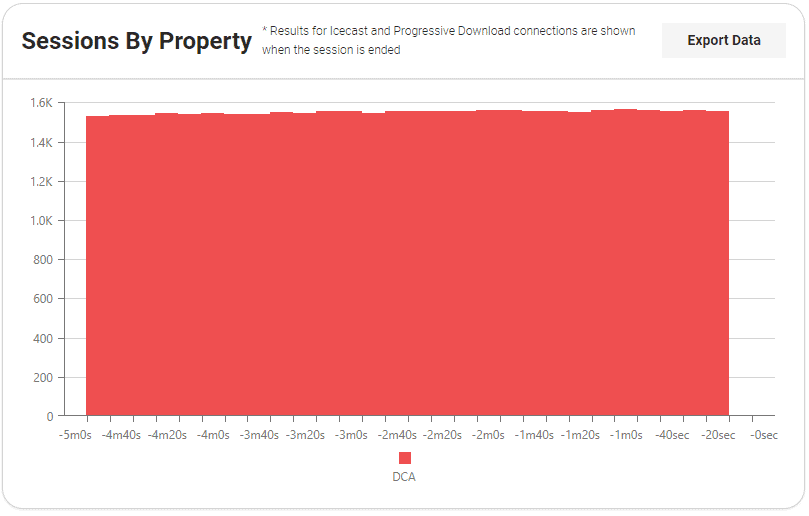
This graph shows the sessions count by property in realt time, with a frequency of data population set at ten seconds, from the past five minutes to now. Results for Icecast and Progressive Download connections are shown when the session is ended.
Sessions By Business Region
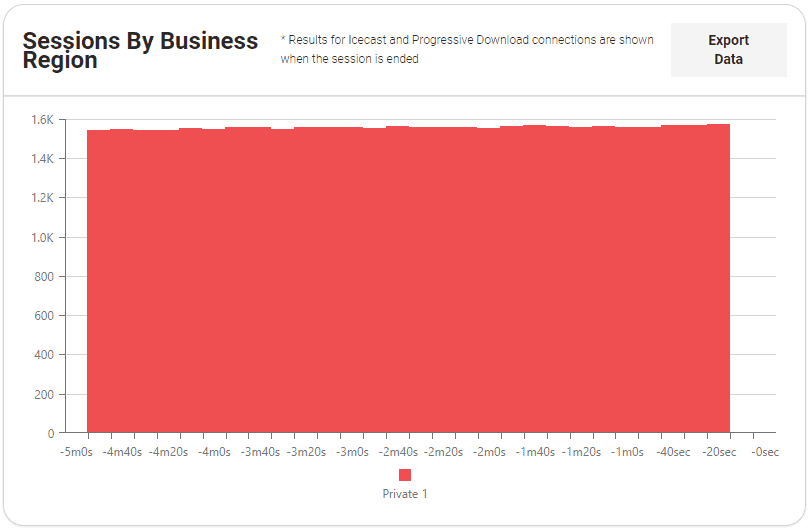
This graph shows the sessions count by business region in realt time, with a frequency of data population set at ten seconds, from the past five minutes to now. Results for Icecast and Progressive Download connections are shown when the session is ended.
Most Followed By Property

This table shows the most followed contents being viewed in real time by property, with a frequency of data polupation set at ten seconds, from the past five minutes to now, giving you the information about the Property Code, Property Name and Sessions Count, aggregated by Property Code. Results for Icecast and Progressive Download connections are shown when the session is ended.
Most Followed By Business Region

This table shows the most followed contents being viewed in real time by business region, with a frequency of data polupation set at ten seconds, from the past five minutes to now, giving you the information about the Property Code, Property Name and Sessions Count, aggregated by Business Region Name. Results for Icecast and Progressive Download connections are shown when the session is ended.
Response Codes
Hits

This graph shows the Edge hits response codes in real time, with a frequency of data polupation set at ten seconds, from the past five minutes to now, helping you understand what is happening with your content. Results for Icecast and Progressive Download connections are shown when the session is ended. 2xx represent requests successfully received 3xx represent a redirection 4xx represent client errors 5xx represent server errors Other represent additional response codes not commonly seen On top of the STACKED and NORMAL visualization, you can select HISTOGRAM where you can see the different codes count separated.
Traffic Details

This table shows the contents traffic in real time, with a frequency of data polupation set at ten seconds, from the past five minutes to now, giving you the information about Service Code, Property Name, 2xx, 3xx, 4xx, 5xx, Other and Total, aggregated by ContentID. Results for Icecast and Progressive Download connections are shown when the session is ended. 2xx represent requests successfully received 3xx represent a redirection 4xx represent client errors 5xx represent server errors Other represent additional response codes not commonly seen
Hits
Hits Per Property
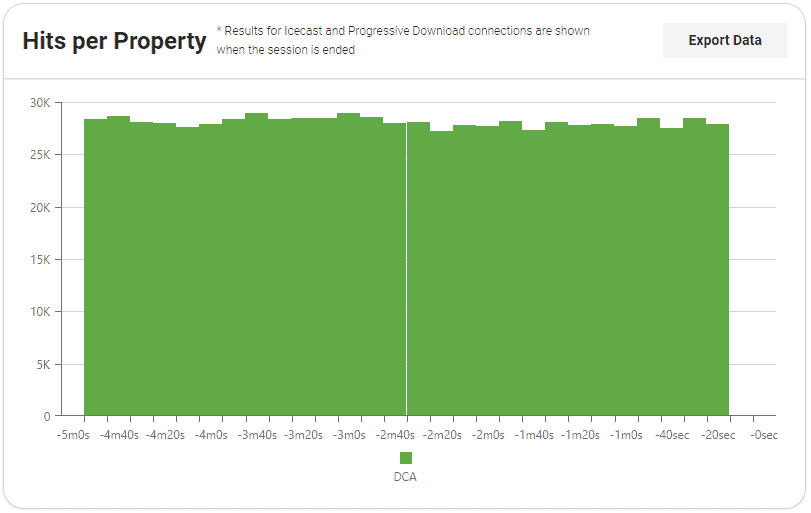
This graph shows how many requests were managed by the Edge servers per property, with a frequency of data polupation set at ten seconds, from the past five minutes. Edge Hits represents how many requests were made for content by the player and how many times those requests were handled by the Edge servers. Results for Icecast and Progressive Download connections are shown when the session is ended.
Hits Per Business Region
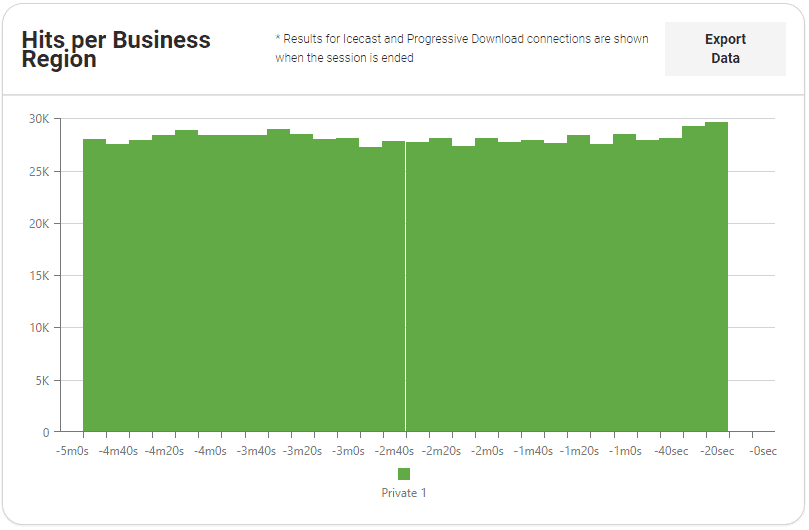
This graph shows how many requests were managed by the Edge servers per business region, with a frequency of data polupation set at ten seconds, from the past five minutes. Edge Hits represents how many requests were made for content by the player and how many times those requests were handled by the Edge servers. Results for Icecast and Progressive Download connections are shown when the session is ended.
Top hits per Property

This list shows the top hits per property giving you the information about Service Code, Property Name and Hits, aggregated by Service Code. Clicking on the columns title you can sort the data, ascending or descending. You are able to scroll vertically through the results as well. Results for Icecast and Progressive Download connections are shown when the session is ended.
Top hits per Business Region

This list shows the top hits per business region giving you the information about Business Region Name and Hits, aggregated by Business Region Name. Clicking on the columns title you can sort the data, ascending or descending. You are able to scroll vertically through the results as well. Results for Icecast and Progressive Download connections are shown when the session is ended.
Volume
Volume Per Property
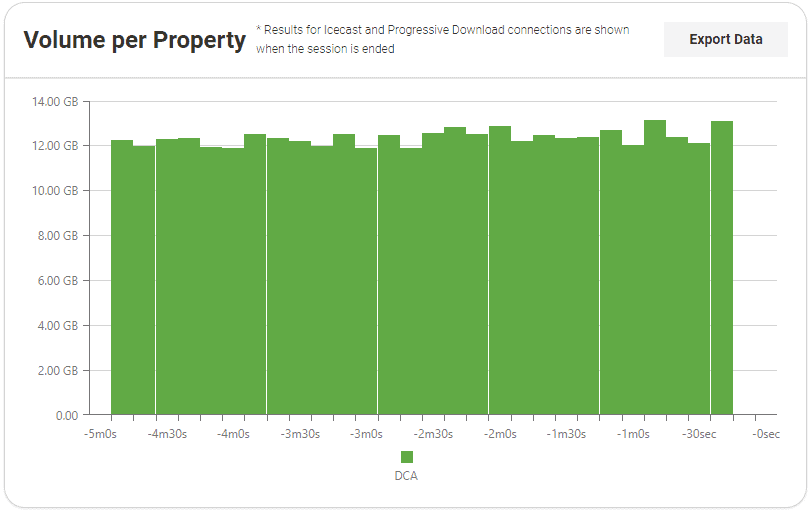
This graph shows the volume of requests managed by the Edge aggregated per property, with a frequency of data polupation set at ten seconds, from the past five minutes. Results for Icecast and Progressive Download connections are shown when the session is ended.
Volume Per Business Region

This graph shows the volume of requests managed by the Edge aggregated per business region, with a frequency of data population set at ten seconds, from the past five minutes. Results for Icecast and Progressive Download connections are shown when the session is ended.
Top Volume Per Property

This list shows the top volume of each property giving you the information about Service Code, Property Name and Volume, aggregated by Service Code. Clicking on the columns title you can sort the data, ascending or descending. You are able to scroll vertically through the results as well. Results for Icecast and Progressive Download connections are shown when the session is ended.
Top Volume Per Business Region

This list shows the top volume of each property giving you the information about Service Code, Property Name and Volume, aggregated by Service Code. Clicking on the columns title you can sort the data, ascending or descending. You are able to scroll vertically through the results as well. Results for Icecast and Progressive Download connections are shown when the session is ended.

